
Mid-winter snowpack settlement
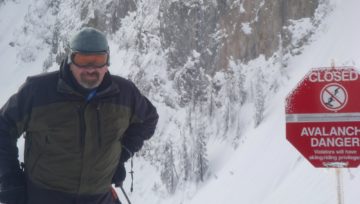
It can be slightly depressing and somewhat sobering when you drive out into the mountains to find rain and spring conditions in the middle of January. Having said that, the current weather scenario was not exactly a surprise, so in many ways we were well prepared mentally for what we were about to encounter.
We arrived today to a light drizzle, +5C at Fraser and got a brief look around at what the recent spring-like temperatures had done to the snowpack. Walking around in the snow, it was obviously that the upper snowpack is quite saturated and moist. No doubt, when this warming trend is over, we will have a fancy new rain crust to add to the mix. How high it goes? Well that is still to be determined. Here is Snow Talks with the current conditions:
Maybe I am a bit of an optimist, but I do try to find the silver lining in most scenarios….no matter how bad. If you think longer-term (beyond this weekend lets say) then yes there will be a rain/melt-freeze crust that will be buried by subsequent snowfalls and may or may not be a problem (unfortunately I am leaning towards the ‘may’ column) in the future. But, you can also look at the recent warm temperatures as bit of a blessing in disguise. The warm temperatures and rain/heavy snow are causing the snowpack to settle rapidly. Take the screenshot below for example, this shows the snowpack settling at a consistent pace over the last week, where the snowpack went from 143cm (9 days ago) to 113cm today. A settled snowpack usually equates to a stronger, more mature snowpack. This will become the mid-pack or “building blocks” for the rest of the season and help bridge the weaker basal layers below.

This full profile that was completed a few days ago in the Fraser Wx Plot (860m):

Now compare that with a profile from early January of last year (2013):

Do not get to carried away with trying to decipher what these profiles mean but there are two contrasts that I would like to point out (highlighted by the red ovals). The upper red oval shows the mid-pack or halfway down the snow profile (both of these were dug to ground, with the top of the graph representing the surface of the snowpack and the bottom representing ground). The blue horizontal bars represent hardness of the snow, the further left, the stiffer the snow. If you look at the upper graph (2014) you notice the mid-pack is significantly stiffer in hardness and deeper (there is more of it) compared to the bottom graph. The second thing you notice is the lower snowpack (represented by the 2nd red oval) is also stiffer but less thick than the Jan 2013 lower snowpack. This represents the basal weak layer of depth hoar and facets that is a common problem in the Yukon.
There is inherent problems from just comparing one season to the next. For one, last year was seasonably colder than average and at that point in the season, we had a fundamentally weak and shallow snowpack. The second ‘disclaimer’ is that this profile represents just one location, and conditions change dramatically- specifically in shallow, wind scoured snowpack areas and areas to the north, Powder Valley and the Wheaton Valley where the basal layer is more pronounced.. The take home though or silver lining is, yes we have had some seasonably warm weather lately that have and are producing a multitude of crusts in the upper snowpack. These crusts will likely pose problems moving forward and we will be keeping an eye on them. BUT, there is a positive outcome and that is it is building a stronger mid-pack that we are likely more accustomed to finding in more coastal snowpack regimes or later on in the spring.
Now we just need to pray for snow:)


Comments